My late stepfather, who was a good salesman, used to tell me "you can’t sell what you don’t have." He was referring to the fact that it is hard to convince customers to buy something that they can’t see or that they have to wait for. Most customers want instant gratification, which is a mindset that e-commerce has had to battle from day one. There’s just no way to give customers instant gratification if their orders have to be shipped to them. This situation is part of why about 75% of shopping carts are abandoned before checkout.
Once you do get customers used to the idea of waiting for a shipment, you still need to assure them that you have what they want in stock, so the shipment can go out immediately. However, if you resell items that you must acquire from a supplier, then maintaining higher stocking levels to ensure availability ties up your cash. Higher inventory levels also increase the risk that a product line enhancement will render your stock obsolete.
The secret to success becomes maintaining the minimum stocking level necessary to meet your sales. This simple sounding goal has resulted in some of the most complex (and expensive) business software in existence. I know because I’ve worked on some of it. Most inventory management software is complex because it tries to do everything for you, from accurately tracking quantity-on-hand, to forecasting your inventory needs using statistical analysis of your historic sales patterns. For many small business owners, paying for this level of sophistication is overkill.
Some small business accounting packages, like QuickBooks, can help you track your inventory levels, but for ordering, they often expect you to supply a reorder point and reorder quantity. They don’t help you much in determining what those figures should be. Also, using reorder point assumes that your inventory data is updated daily and that you are ready to place an order on any given day. My guess is that most small business owners don’t have time to deal with updating QuickBooks and managing inventory every day.
The approach I’m going to show you assumes that you set aside time to place orders on a regular schedule (weekly, monthly, or whenever). When I’m done, you’ll know how to minimize the inventory you keep on hand while making sure you have the items in stock when your customers ask for them. Everything you’ll learn helps you answer one critical question: How many items do I need to order?
Inventory Management Worksheet
As the title suggests, this article shows you how to use an Excel worksheet to figure out how many items you need to order. You only need a few cell formulas, and most of them are very simple.
The spreadsheet I’ll show you how to build looks like this when you are done:
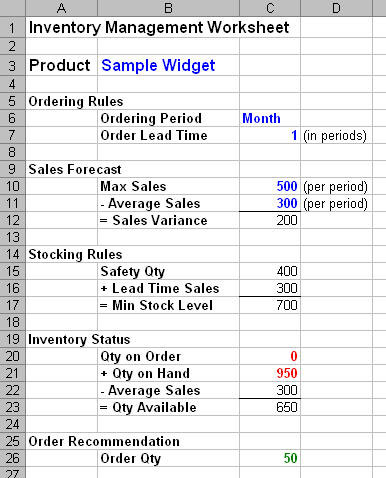
Completed inventory worksheet
Calculating how many items to order is a simple matter of comparing how many items you’ll have at the end of the current ordering period (Qty Available) versus how many items you need to have to make it through the next period (Min Stock Level). Figuring out how many items you have available is fairly easy if your accounting software tracks current inventory quantity. You’ll want to make sure those figures are up-to-date before you sit down to place orders. Determining how many items you need to have is a little trickier, but once you figure it out, it usually doesn’t change very often.
In the rest of the article, I’ll show you how to set up each section of the worksheet. When you are done, you’ll be able to calculate an order quantity, and all you’ll have to do is provide your current quantity on order and quantity on hand.
Setting up the Basics
Keep in mind that you need to create a separate worksheet for each product you want to manage. However, once you set up the first product, you can just copy its worksheet and tweak the values for the next product.
Start by entering the worksheet title in A1 and the Product label in A3. Put the product name or identifier in B3. You’ll notice that some of the cells in my worksheet are blue. Those cells are for input that you’ll need to change for each product, but that doesn’t usually change every ordering period. If you use a similar coloring scheme, you can quickly identify what fields to change when you create a new product worksheet.
The Ordering Rules section has values that almost never change. Enter the Ordering Rules section label, the Ordering Period label, and Order Lead Time label as shown in the example.
In the Ordering Period data cell (C6), enter how often you place orders. This is just for your reference, but it can be helpful if you manage some products on one schedule and others on a different schedule.
In the Order Lead Time data cell (C7), enter the number of periods you have to wait for an order to arrive. Always round up. For example, if you order once per week and it takes 10 days for an order to arrive, your lead time is 2 weeks.
Calculating Minimum Stocking Level
As I described earlier, the formula to determine how many items you need to order goes like this:
[Order Qty] = [Min Stock Level] – [Qty Available]
So, what is a minimum stocking level? It is the number of items you need to keep on hand in order to avoid running out before you can get more items.
It may take a while for your order to arrive, so you have to have enough items to handle the sales while you are waiting for it. This figure is called your "lead time sales."
Also, your sales could be much higher than you anticipated (you can hope so, anyway), so the order you just placed may not be sufficient to carry you through the next ordering period. You can plan for that possibility by adding a fudge factor called "safety quantity." I’ll show you how to calculate a safety quantity later in the article.
Estimating a Sales Forecast
In order to figure out your lead time sales and a safety quantity, you first have to estimate your maximum and average sales. These figures will let you calculate a sales variation, which is one component of your safety quantity formula. This is where the Sales Forecast section of the worksheet comes in.
Enter the Sales Forecast section title in A9, and the Max Sales label in B10, the Average Sales label in B11, and the Sales Variation label in B12. If you want to include the minus and equal signs on the labels as shown in the example, be sure to start the label with an apostrophe (‘) so Excel knows you are entering text, not a formula.
In the Max Sales data cell (C10), enter the maximum number of items you expect to sell in the coming period. In the Average Sales data cell (C11), enter the average number of items you expect to sell in the coming period. In the Sales Variance data cell, enter the following formula:
=C10-C11
As you can see, the Sales Variance is the difference between your average expected sales and your maximum expected sales.
I colored the sales forecast figures in blue because they are values you might need to change once in a while, but not necessarily every ordering period. The Sales Variance is black because it is not something you will ever change: it is calculated from other cells for you.
Calculating Stocking Rules
The Stocking Rules section of the worksheet uses your estimated sales figures to calculate a safety quantity, and ultimately, your minimum stocking level. Start by entering the labels as shown in the example worksheet. Then enter the formulas as described below.
In the Safety Qty data cell (C15), enter this formula:
- =C12 (C7 + 1)
The formula says to take the Sales Variance and multiply it by the Order Lead Time plus one extra period. Conceptually, it means your safety quantity is the number of items you would need to cover your maximum sales through the current ordering period and through the order lead time for the next ordering period. Even if you max-out your sales indefinitely, you would still have enough items to be covered.
In the Lead Time Sales data cell (C16), enter this formula:
- =C7 C11
The formula says to multiply your Order Lead Time by your estimated Average Sales. It is the number of items you need to get through the current period’s order lead time.
Finally, in the Min Stock Level data cell (C17), enter the following formula:
=C15 + C16
It says that your Min Stock Level is the product of your Lead Time Sales and your Safety Qty. You should always have at least this many items on hand at the beginning of a period.
Note that, consistent with the coloring scheme I’ve used so far, all of the figures in this section are black because they are all formulas.
Calculating Quantity Available
Okay, it is time to recall the order quantity formula:
[Order Qty] = [Min Stock Level] – [Qty Available]
You’ve seen how to calculate the Min Stock Level variable. Now you’ll see how the Inventory Status section calculates Qty Available, which is the second variable we need to calculate an order quantity.
For the purpose of inventory planning, quantity available is the number of items you will have at the end of the current period if you do not place an order now. As you’ll see, your decision to order now really hinges on where you will be at the beginning of the next period. You must start every period with at least your minimum stocking level, or you may not have enough items to get through a complete order cycle.
Entering Your Inventory Status
To set up the Inventory Status section, first enter the labels as shown in the example.
In the Qty on Order data cell (C20), enter the number of items you currently have on order from prior ordering periods. This figure should always be 0 if your Order Lead Time is 1 because all orders should arrive before the next ordering period.
In the Qty on Hand data cell (C21), enter the number of items you currently have in stock. I colored this cell and the Qty on Order cell red because you will almost always have to update these figures for every ordering period.
In the Average Sales data cell (C22), enter this formula:
=C11
The formula just copies your average estimated sales into the cell so it is clearer how your quantity available was calculated in the Inventory Status section.
In the Qty Available data cell (C23), enter the following formula:
=C20+C21-C22
The formula says to add your quantity on order to your quantity on hand, and subtract your average expected sales for the current period. That tells you how many items you will have at the end of the current ordering period if you don’t place an order.
Calculating the Order Quantity
The last section of the spreadsheet is the Order Recommendation. Once again, start by entering the labels as shown in the example.
In the Order Qty data cell (C26), enter this formula:
=IF((C17-C23)>0,(C17-C23),0)
The formula looks more complicated than it really is. It basically says to subtract the minimum stocking level from the quantity available. If the result of the calculation is greater than 0, it uses the calculated value; otherwise it displays 0.
Even though the quantity available cell is a calculated value, I did color it green instead of black to make it stand out. That figure is what the entire worksheet is designed to compute, after all.
There you have it! You now have a worksheet that will tell you exactly how many items to order, and all you have to do each period is provide your quantity on order and your quantity on hand. You can optionally adjust your expected sales figures as well, and the worksheet will adjust your minimum stocking level and order quantity accordingly.
Adding More Product Worksheets
Once you create your first worksheet, it is easy to create another one for a different product. Just follow these steps:
- Choose Edit|Move or Copy Sheet from the menu. Excel displays the Move or Copy dialog box.
- Select a location for the new worksheet in the "Before sheet" list.
- Check the "Create a copy" check box.
- Click the OK button to copy the worksheet and close the dialog box.
You can then right-click over the new worksheet’s tab and choose Rename from the popup menu to give the tab an appropriate name.
What’s Your Time Worth?
Do you like the idea of managing your inventory in Excel, but you don’t have the confidence or time to set up the worksheet yourself? Do you wish you had more background information on how and why the worksheet works? We have a solution for you. Through the Logical Expressions Store, you can purchase the worksheet along with a companion white paper. The white paper provides basic instructions on how to use the worksheet as well as an explanation of the inventory management theory behind the calculations. These two items come packaged in an installation file that you can download and use immediately.
The Inventory Worksheet Package includes a more robust worksheet than the simplified one demonstrated in this article. It’s additional features include:
- A product ID cell so you can note the product’s part number.
- Bulk quantity cells so you can order by the case or other bulk unit of measure.
- Support for vendor-mandated minimum order quantity.
Save yourself some time. Buy the Inventory Worksheet Package today!