In parts 1 and 2 of this article series, I covered techniques for collecting the requirements for your project. Now that you know what you need to do, you can start working on how you will do it.
As I’ve mentioned before, analysis and design work together in an iterative fashion. Analysis tears down a process so you can understand its inner workings. Design builds up a process from separate elements. Since you can never anticipate everything you will need to complete a new design, you occasionally have to drop back into analysis mode to improve your understanding of the business rules that the design must accommodate.
Unfortunately, additional analysis usually reveals more than you anticipate. You may find that the new or expanded requirements you uncover have a significant effect on parts of the project that you have already designed. This situation is exactly why you don’t start coding until you have performed enough analysis and design to uncover most of the hidden or implied requirements.
Performing a thorough analysis and design for a project requires specialized tools that guide you though the process. One of the best tools to use early in the process is a modified data flow diagram (DFD), which is what I’ll cover in this article.
DFDs have fallen out of vogue somewhat over the past decade. I suspect this is partly because DFDs came out of Structured Analysis and Design, which has been supplanted by a number of object-oriented methodologies. I still use DFDs because they are easy for clients to understand and don’t require expensive software to create.
A DFD does a great job of getting you thinking about several aspects of your project, including the system architecture, inputs and processes, data structures, and modularization of code.
Sample Project
Now that I’m presenting specific tools for you to work with, it’s also a good time to introduce a specific demonstration project. I’ll continue to use this project going forward as I discuss additional tools and techniques.
The project I propose to use is one that any Internet developer can relate to: a Web site log processor. Although there are plenty of log processing tools out there on the market, you sometimes want to extract information that they don’t provide, or you don’t want to pay a fortune for the version that can get the information you need. Fortunately, your Web site’s logs are usually easy to acquire and they are certainly easy to parse, so gaining access to the raw data you need should not be a problem.
The log processor I’m going to build will solve a real-world problem for real-world customers. These customers use the content management software I wrote for online publications called the LEI E-Zine Power Publisher (LEPP). My goal is to give my LEPP customers a way to determine the popularity of their articles for a selectable date range.
The problem is that the LEPP is a data-driven application, so a single ASP page serves up all articles. The statistics software we use shows stats by page, but doesn’t give you a way to break down the stats using query string values. The query string, which includes the article identifier, is the only way to differentiate articles.
There are ways to solve this problem other than processing the site logs. I could add hit counting to the public Web interface, so every article viewed would log a hit to the database. I don’t like that approach because the public interface currently only needs read access to the database, and I’d like to keep it that way for stability, security, and scalability reasons. Besides, the information I need is already being logged by IIS.
To illustrate the techniques I covered in previous articles, I’ve started a
project design document for the log processor and made it available to you in
PDF format (right-click this link and choose Save As: Log
Processor Design Document). This sample design document will grow with each
article as I flesh out the details of the project. The sample includes the techniques
I’m about to cover here as well.
As I mentioned, my primary mission for this project is to give my LEPP customers a way to see popularity statistics for their articles. One business requirement is that the users need a way to create a report that shows the article title and the number of page hits for a specified date range. Another business requirement is that the log-parsing engine should be built in such a way that it could be reused for my other data-driven sites. You can find a more detailed description of the mission and requirements in the design document.
Sample DFD
Now that I know what I need to do, I’m going to put together a DFD to help me figure out how to do it. But first, I should make something clear. The DFD I’m about to demonstrate is based on the official definition for a DFD, but does not follow that definition entirely. I tend to take the best features of the techniques I learn and modify them for my own purposes. I encourage you to do the same. I find nothing more tedious than people who argue over how something is "supposed to be done." Keep the best and dispose of the rest.
My first step is to create a high-level, conceptual flow of the project (see figure 1).
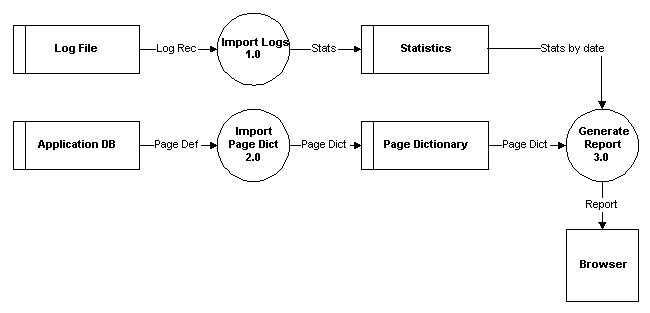
Figure 1 shows several of a DFD’s basic elements:
- The four rectangles represent "data store" elements. A data store is data at rest. In other words, it is a database table or file where data can reside indefinitely.
- There are three numbered circles that represent "process" elements. A process transforms data, frequently taking an input flow from one data store and producing an output flow into another data store.
- There is a single square that represents a data source or data destination. A data source is a place where data enters the system, and a data destination is a place where data leaves the system.
- Arrowed lines connect the other diagram elements. These lines represent "data flows," or as I prefer to call them, "data packages."
Now I’ll explain how I used these elements:
- The Log File data store represents the log files that IIS generates as visitors navigate the LEPP Web site.
- The Import Logs process summarizes the information it extracts from the log files into statistical data. A Log Record data package flows into this process and a Stats data package flows out. At this point, my thinking is that I don’t want to save every record in the log files because that would be a lot of data to maintain for little benefit (with regard to my requirements). Remember, the logs contain one record for every file that gets downloaded to every browser, and that includes all of the graphics as well as the pages themselves.
- The Statistics data store is the permanent repository for my summarized statistical data.
- The Application DB data store represents the existing application database that has the descriptive information I need to tie in with the log data.
- The Import Page Dictionary process accepts Page Info data packages, which contain application-specific data, and transforms them into generic Page Dictionary packages that can be joined to the statistical data from the logs.
- The Page Dictionary data store represents the descriptive information for each application Web page.
- The Generate Report process merges statistical data with the page dictionary to produce an Article Popularity report on the user’s Web browser.
To be complete, my diagram should also have data sources and processes to represent how data gets into the log file and how it gets into the application database. I didn’t include those elements for brevity and because that part of the system is already in place.
Drilling Down
Don’t be afraid to break the DFD down into more detailed diagrams if that’s
what it takes to fully think through your project. In fact, that is what the
process numbering scheme is for. I broke down the Import Logs process into another
diagram because a lot goes on there (see the design document for more information).
In my more detailed diagram, I number the processes 1.1 and 1.2 because they
are components of process 1.0. Further breakdown would produce processes 1.1.1,
1.1.2, etc.
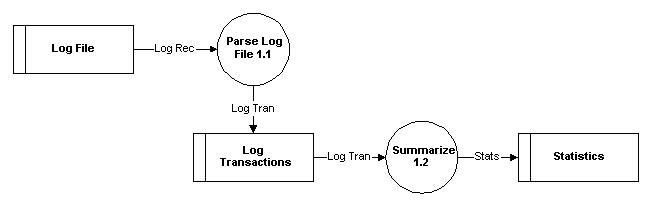
I recommend that you drill down into more detailed DFDs until you can easily
visualize how you will build the solution behind each process bubble. You know
you are have gone too far when you try to include conditional logic (e.g. if/else
branching) in the diagram.
Moving Forward
A DFD helps you organize and connect the functional elements of your project. You can use this big picture view to prioritize your development efforts and quickly identify areas that need special attention. It makes a great project planning tool.
A DFD also gets you thinking about some important issues that should be considered before you start building. I group these issues into the following general categories: system architecture, modularization, technical challenges, and incomplete requirements.
System Architecture
A project’s system architecture describes the required computing resources and timing concerns.
Looking at the log processor’s DFD, you can see that all of the processing will probably take place on the Web server that hosts the LEPP Web site, because that is where the log files are located and that is where you will display the report. However, a different project might be spread across several systems, and your DFD will help you identify which processes should be located where.
As for timing, you know that the server is configured to write to a single log file during the course of a day, and that a new log begins at 12:00 AM UTC (UTC stands for Universal Time Coordinate, formerly Greenwich Mean Time). You could schedule the import process to run immediately after the daily log is complete, as long as your users don’t need up-to-the-minute statistics.
Modularization
Modularization describes which processes are part of the same program and which data stores should be in the same database.
The log processor’s DFD shows me that there are really two distinct locations for the programming. I’ve decided that the Import Logs process should be a batch operation that runs independently of the application Web site software. On the other hand, I want the Generate Report process to be integrated into the application’s user interface so users can request the report on demand.
The Import Page Dictionary process could go either way. The application could push the page dictionary to the log processor’s database in real time as changes are made, or the log processor could pull the page dictionary from the application’s database as part of the log import. Remember: one of my requirements is that I want to reuse the log processor for other data-driven applications. I choose to push the information from the application because I believe it will be easier to maintain one log processor interface definition instead of a separate interface for each application the log processor services.
Technical Challenges
Most projects have at least one requirement that you’ve never addressed before. For me, that is what makes software development interesting. I would get bored if I were doing the same old thing the same old way, project after project. Fortunately, my customers never let that happen.
Your DFD helps you identify areas of the project that require additional investigation. I mentioned before that you want to refine the DFD until you can clearly visualize how you will build the project. That can be difficult if you need to do something you’ve never done. For example, if you’ve never seen a Web site log file, you may want to check one out to get an idea of how you will parse it.
For me, these investigative opportunities are the highest priority as you get into the development phase. Never build a project around technology that, according to the vendor, works great. Test it first. Create a quick-and-dirty test program that exercises the critical elements you will need to use in your software.
I’ve seen projects fail miserably (and expensively) because they were based on technology that wasn’t really ready for prime time after all. I have a saying about this: On the bleeding edge, the blood is usually the customer’s.
Incomplete Requirements
There is no way you will get all of the requirements out of your customers at the beginning of the project. As you analyze the project and show them your progress, they will come up with critical issues that they forgot about or that someone new to the project brought to the table. Don’t fight it, prepare for it. The DFD helps you explain where you are going with the project so the missing requirements tend to get noticed quicker.
At the same time, your DFD will help you uncover issues that require further clarification. For example, knowing that the log files are in UTC, does the user want you to adjust the log times to local time for reporting purposes? Don’t assume the answer to questions like this. Users will sometimes surprise you.
As soon as you uncover a question regarding requirements, document it and bring it up the next time you contact your users.
Conclusion
This article demonstrated the Data Flow Diagram, which is the first design tool I pull out of my toolbox when beginning a software project. The value of the DFD lies largely in the thought process it stimulates as you create it and consider its implications.
Just as you expect your homebuilder to show up with blueprints, you shouldn’t start a software project without a clear plan of how you will build it. The DFD is just one tool to help you deal with the complexities of a modern software project.
I’ve also introduced a sample project that helps illustrate the points I made in this article. I’ll continue to use the log processor in future articles so you can watch the evolution of this project as I apply additional design techniques.
I hope you’ve been enjoying this article series. Your comments, questions, and suggestions are welcome.